APPENDIX
[Image of page 247]
APPENDIX.
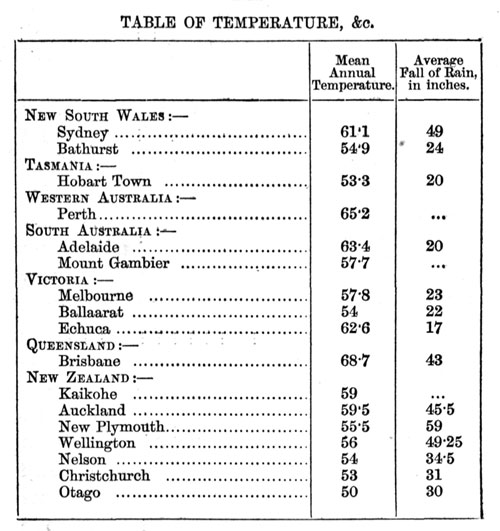
TABLE OF TEMPERATURE, &c.
NUMBER OF EMIGRANTS FROM GREAT BRITAIN IN 1861.
| |
Males. |
Females. |
Total. |
| New South Wales |
983 |
643 |
1,626 |
| Tasmania |
42 |
216 |
258 |
| Western Australia |
69 |
72 |
141 |
| South Australia |
270 |
152 |
422 |
| Victoria |
6,035 |
8,221 |
14,256 |
| Queensland |
1,249 |
1,281 |
2,480 |
| New Zealand |
2,716 |
1,839 |
4,555 |
| Total |
11,364 |
12,374 |
23,738 |
[Image of page 248]
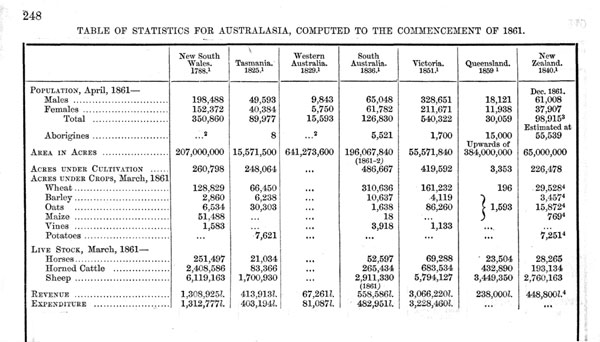
TABLE OF STATISTICS FOR AUSTRALASIA, COMPUTED TO THE COMMENCEMENT OF 1861.
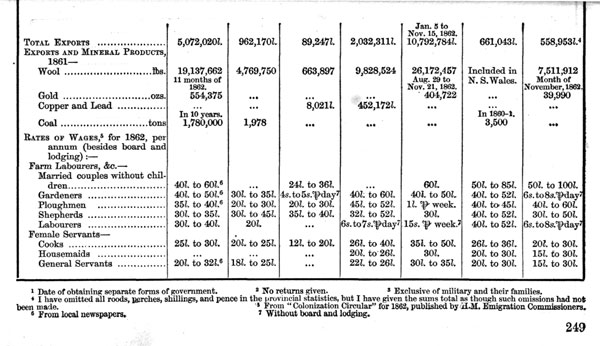
[Image of page 249]
[Image of page 250]
TABLE OF PROVINCIAL STATISTICS FOR NEW ZEALAND, 1861.
| |
|
NORTH |
ISLAND. |
|
|
SOUTH |
ISLAND. |
|
|
| |
Auckland.
1840.* |
Taranaki.
1841.* |
Wellington.
1840.* |
Hawkes Bay.
1858.** |
Nelson.
1842.* |
Marl-
borough.
1859.** |
Canter-
bury.
1850.* |
Otago.
1848.* |
South-
land
1861.** |
Population,
December
1861 |
|
|
|
|
|
|
|
|
|
| Males |
13,494 |
1,169 |
6,626 |
1,667 |
5,342 |
1,503 |
8,939 |
21,161 |
1,107 |
| Females |
10,926 |
875 |
5,940 |
944 |
4,610 |
796 |
7,101 |
6,002 |
713 |
| Total |
24,420 |
2,044 |
12,566 |
2,611 |
9,952 |
2,299 |
16,040 |
27,163 |
1,820 |
| HALF-CASTE |
|
|
|
|
|
|
|
|
|
| Males |
329 |
8 |
66 |
79 |
9 |
26 |
24 |
49 |
32 |
| Females |
260 |
3 |
59 |
56 |
-- |
15 |
22 |
65 |
26 |
| Total |
589 |
11 |
125 |
135 |
9 |
41 |
46 |
114 |
58 |
ACRES
UNDER
CULTI-
VATION |
75,916 |
10,153 |
55,313 |
5,844 |
22,935 |
3,162 |
32,807 |
19,254 |
1,092 |
ACRES
UNDER
CROPS,
Mar. 1861 |
|
|
|
|
|
|
|
|
|
| Wheat |
3,892 |
61 |
2,285 |
550 |
4,395 |
493 |
12,785 |
4,928 |
136 |
| Barley |
214 |
57 |
219 |
36 |
1,126 |
124 |
1,489 |
166 |
22 |
| Oats |
2,329 |
105 |
1,384 |
354 |
1,860 |
341 |
4,535 |
4,517 |
442 |
| Maize |
696 |
4 |
18 |
16 |
12 |
14 |
7 |
3/4 |
-- |
| Potatoes |
3,553 |
166 |
762 |
191 |
515 |
136 |
1,088 |
667 |
171 |
LIVE
STOCK,
Mar. 1861 |
|
|
|
|
|
|
|
|
|
| Horses |
5,621 |
220 |
5,117 |
1,782 |
2,355 |
1,519 |
6,049 |
4,790 |
812 |
Horned
Cattle |
36,482 |
2,171 |
49,323 |
8,320 |
11,105 |
8,474 |
33,576 |
34,544 |
9,139 |
| Sheep |
67,803 |
10,566 |
247,940 |
312,459 |
181,367 |
368,836 |
877,369 |
619,853 |
73,970 |
| REVENUE |
80,461l. |
9,310l |
54,347l |
46,503l. |
33,820l |
20,721l. |
106,129l |
97,511l |
***
[With
Otago] |
| TOTAL EXPORTS |
91,152l. |
3,520 |
137,566l |
18,169l |
73,566l. |
-- |
2O9,454l |
55,526l |
***
[With
Otago] |
* Date of settlement.
** Date of separation from another province.
*** Returns made previous to gold discovery.
[Image of page 251]
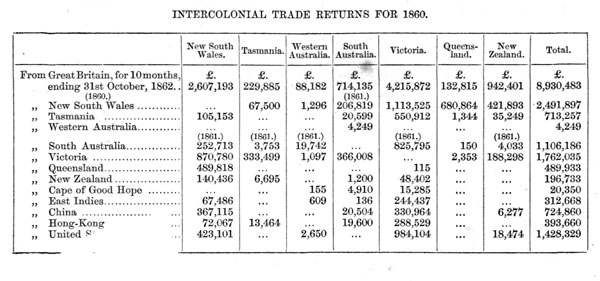
INTERCOLONIAL TRADE RETURNS FOR 1860.
[Image of page 252]
LONDON:
PRINTED BY C. F. HODGSON,
GOUGH SQUARE, FLEET STREET.
[Inserted unpaginated illustration]
|
|
|